Use Cases
The use case model defines all interactions between the four actors (End User, Data Contributor, Administrator, System) and the platform. It is divided into two sets: Observation Prediction (the core analytical domain) and User Management (access control and alerting).
Observation Prediction use case diagram
This diagram maps the Admin and User actors to the full set of spatial data and forecast operations.
Actor responsibilities
| Actor | Use cases |
|---|---|
| Admin | Create Zone, Read Zone, Update Zone (includes Read Zone) |
| User | Create/Read Malaria_Observation, Create/Read NCD_Observation, Create/Read Ground_Observation |
| System/ML | Create Malaria_Risk_Forecast, Create NCD_Risk_Forecast |
| User/System | Read Malaria_Risk_Forecast, Read NCD_Risk_Forecast |
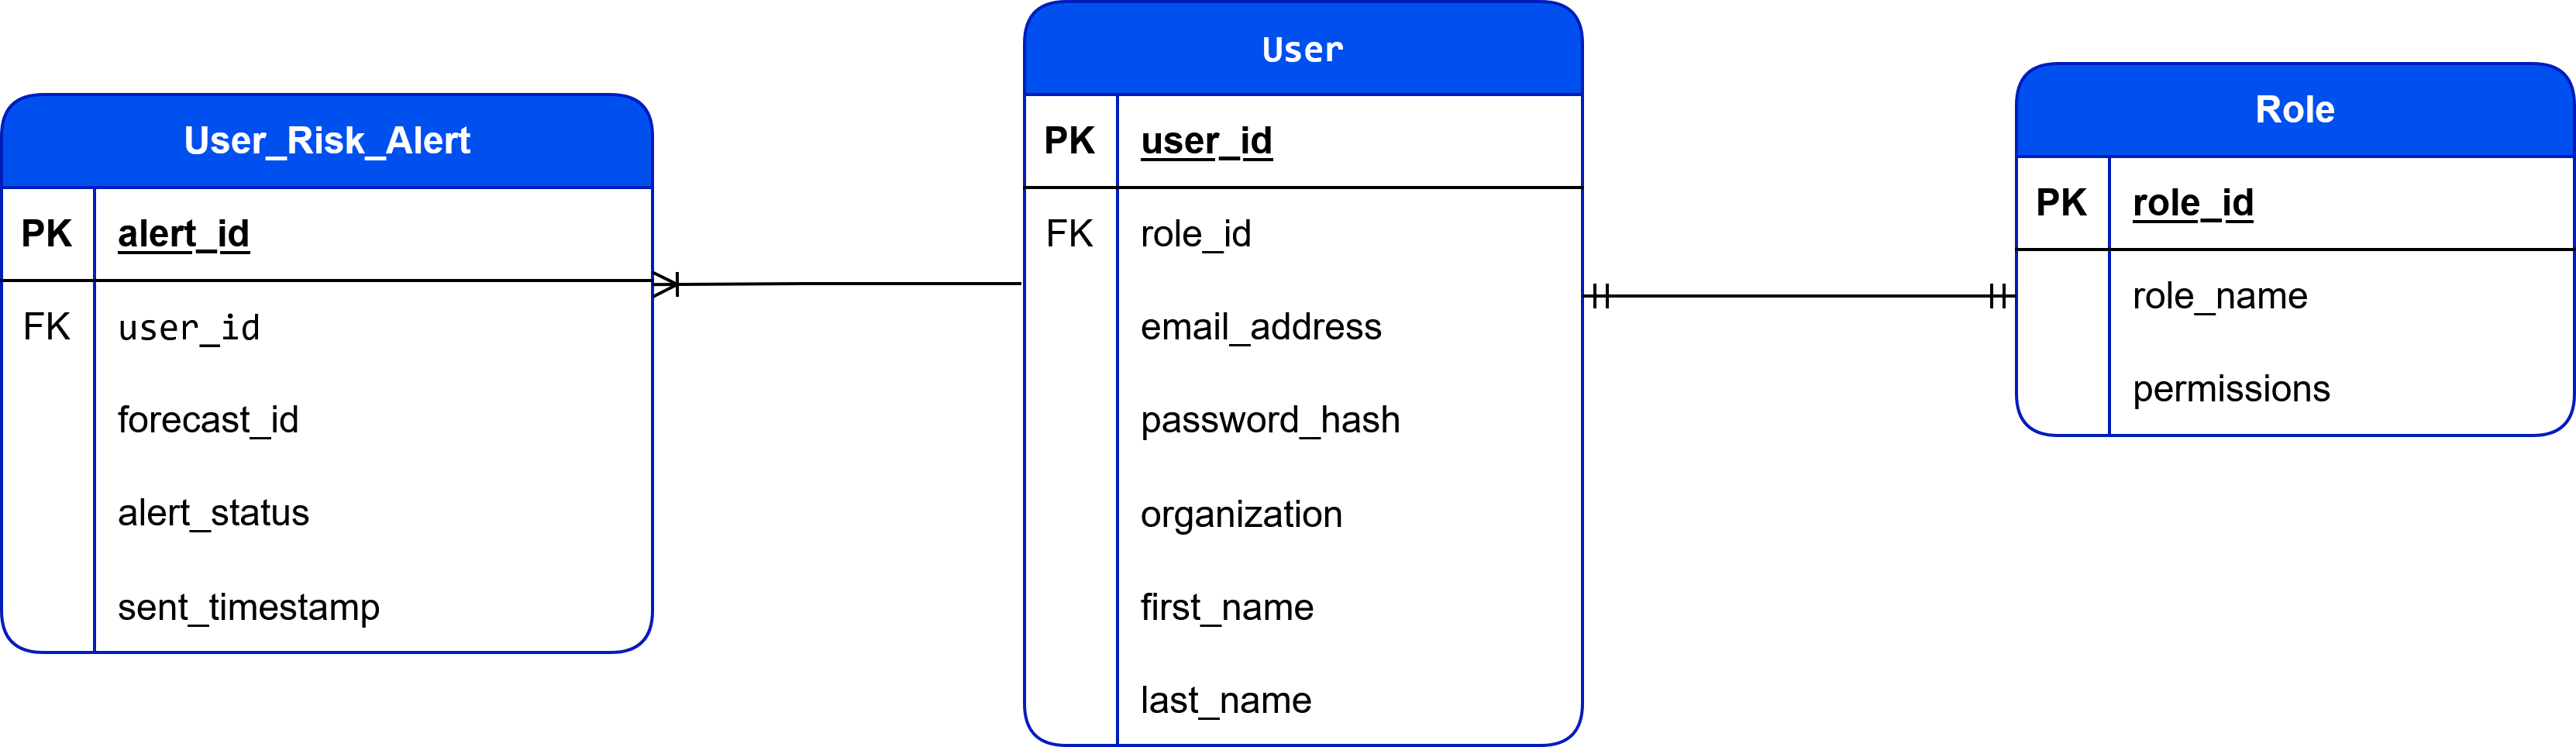
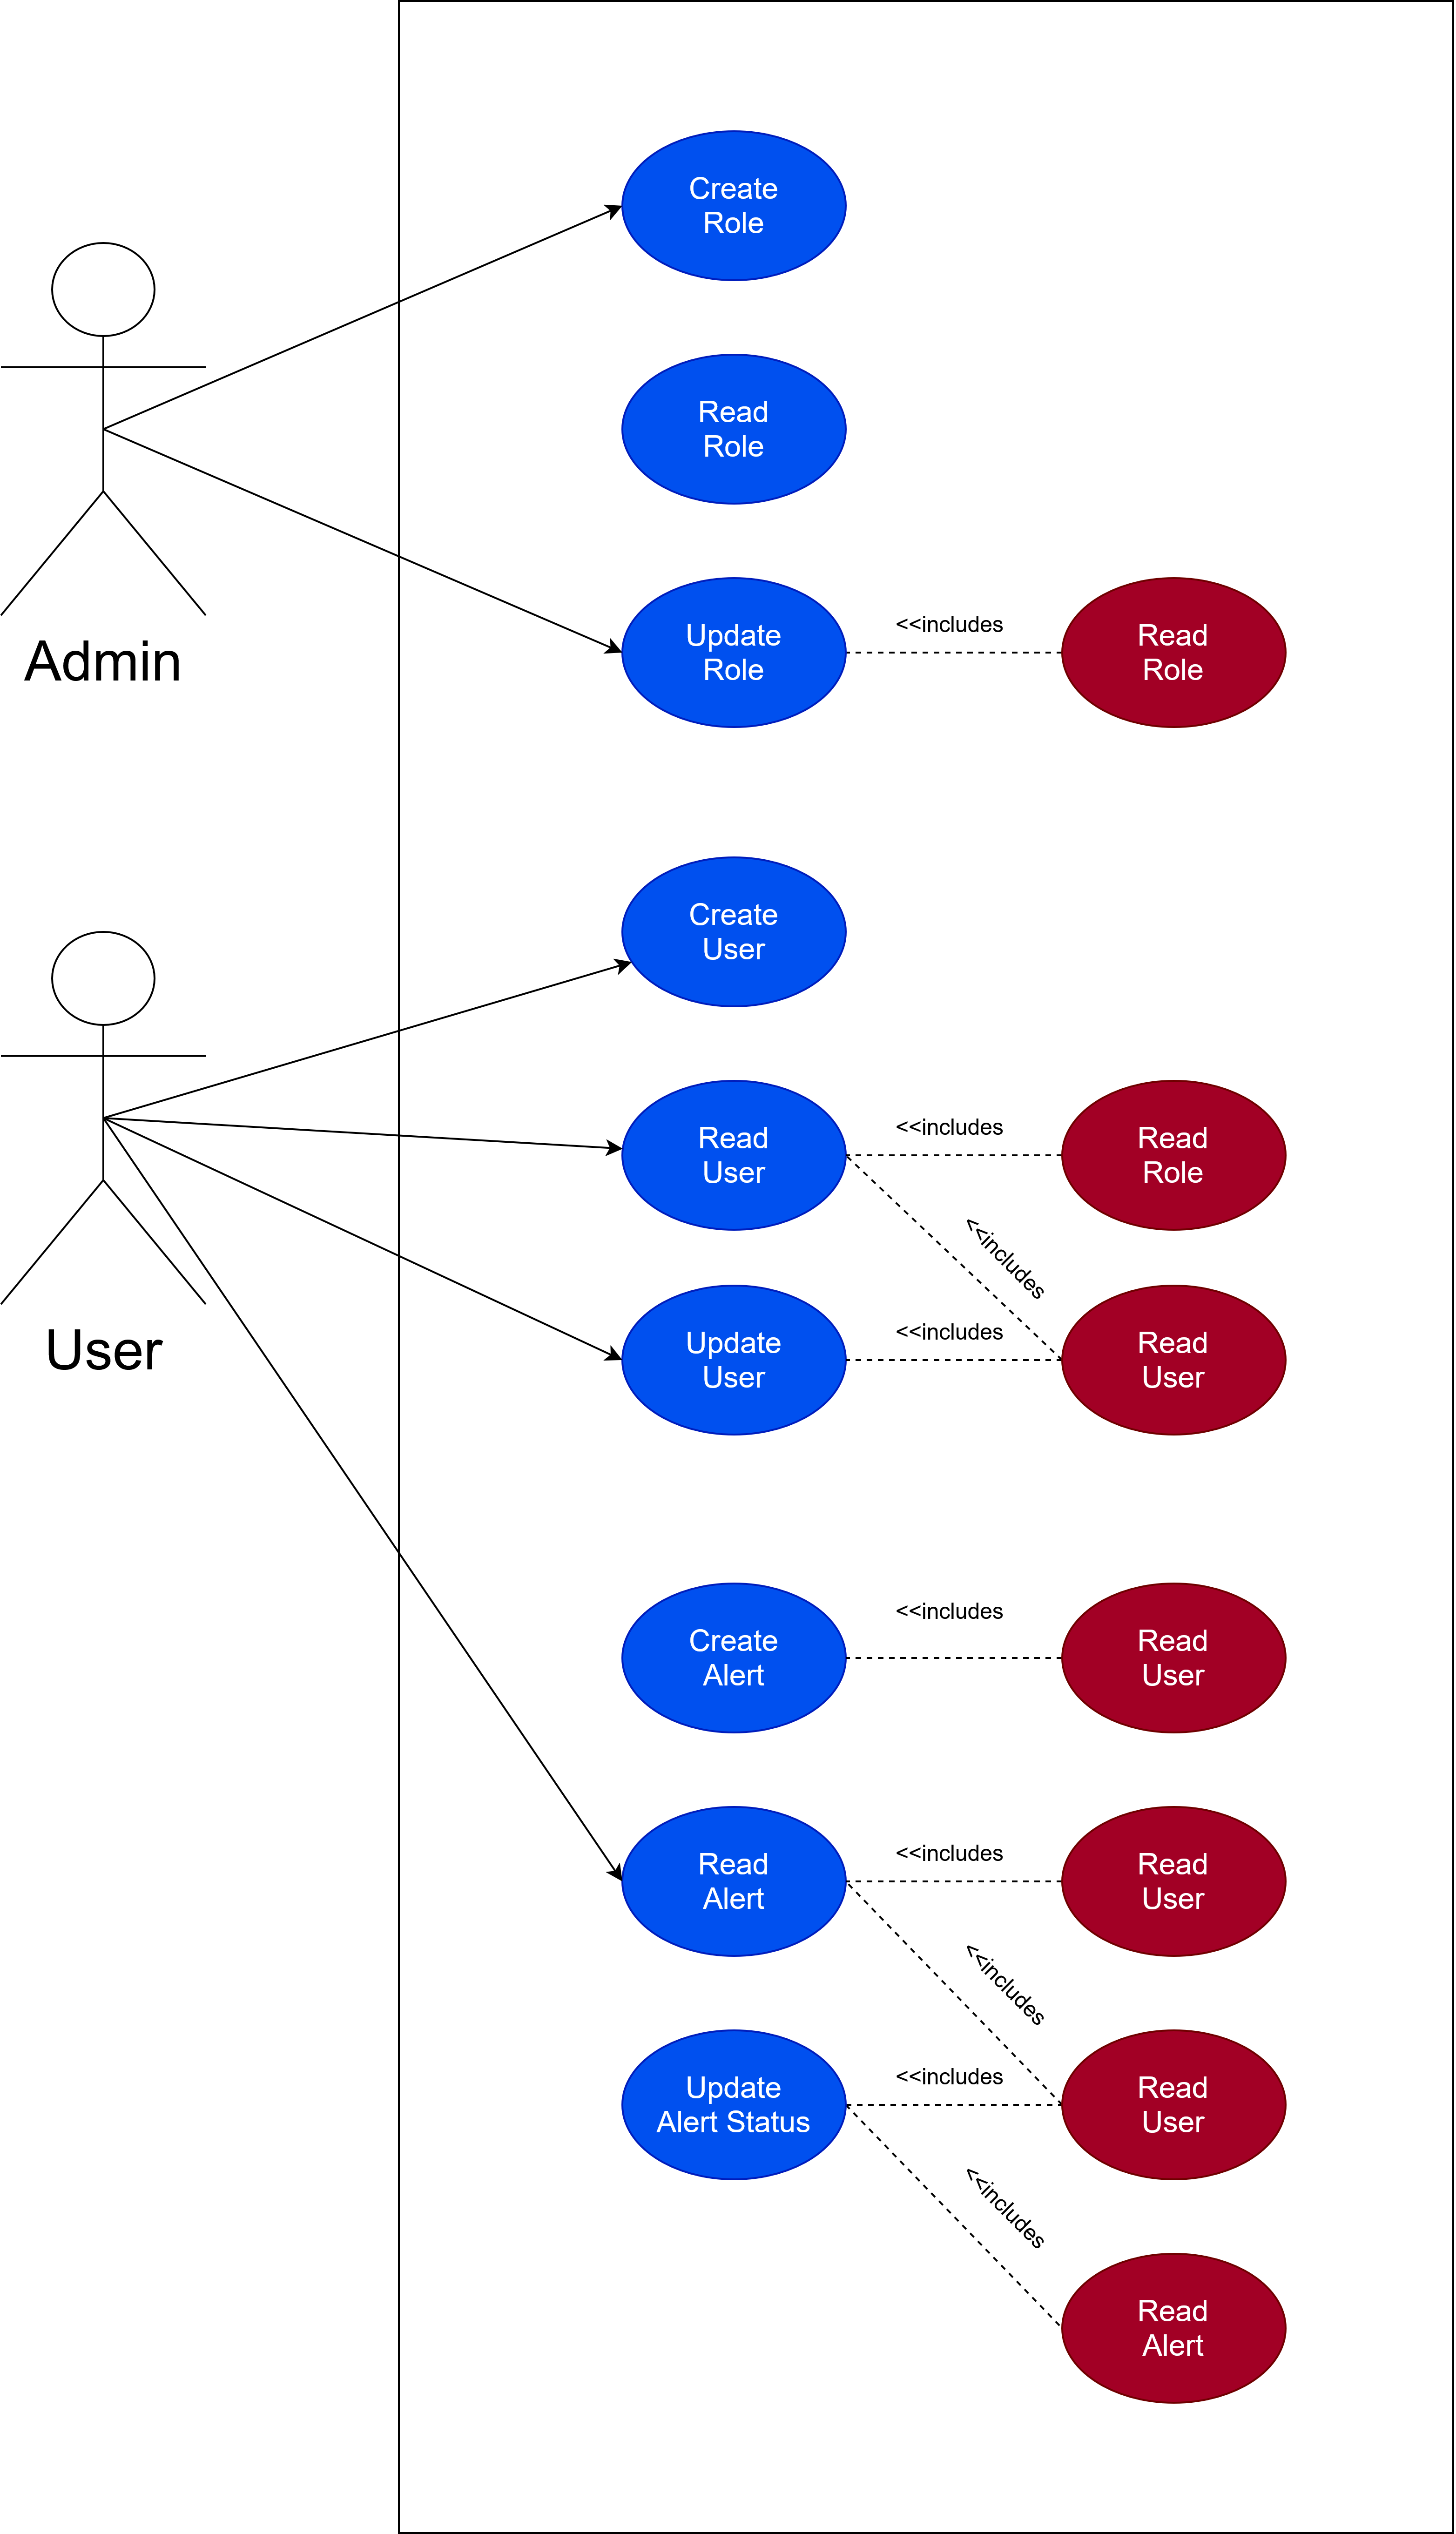
User Management use case diagram
This diagram maps the Admin and User actors to role, user profile, and alert management operations.
Actor responsibilities
| Actor | Use cases |
|---|---|
| Admin | Create Role, Read Role, Update Role (includes Read Role); Create User |
| User | Read User (includes Read Role), Update User (includes Read User) |
| User | Create Alert (includes Read User), Read Alert (includes Read User), Update Alert Status (includes Read User + Read Alert) |
| System | Create Alert automatically on high-risk forecast |
Use case descriptions
Create Malaria_Observation
| Attribute | Detail |
|---|---|
| Trigger | New 8-day satellite imagery batch available from GEE |
| Actors | System Integration Service, External API (GEE) |
| Pre-conditions | ObservationCount > Minimum Threshold; ML model weights loaded |
| Flow | 1. GEE API generates latest imagery → 2. System pulls data for zone coordinates → 3. GEE returns JSON (temperature, soil moisture, water index) → 4. System maps to zone_id → 5. DB validates zone → 6. System inserts Malaria_Observation row |
| Post-condition | New record in MALARIA_OBSERVATION: [env_record_id, zone_id, date_recorded, lst_surface_temp_c, soil_moisture_pct] |
Create Malaria_Risk_Forecast
| Attribute | Detail |
|---|---|
| Trigger | Scheduled integration service fires (every 8 days on new satellite pass) |
| Actors | ML Pipeline |
| Pre-conditions | Sufficient historical training data; ML model weights active |
| Flow | 1. ML Pipeline initiates prediction sequence → 2. Queries lst_surface_temp_c, soil_moisture_pct (READ Malaria_Observation) → 3. Queries aggregated_case_count (READ Ground_Observation) → 4. Applies environmental_lag_days, runs XGBoost → 5. Outputs outbreak_probability_score per zone → 6. DB validates zone_id → 7. INSERT into MALARIA_RISK_FORECAST → IF score > 0.80 → trigger Create User_Risk_Alert |
| Post-condition | New record in MALARIA_RISK_FORECAST: [forecast_id, zone_id, target_prediction_date, outbreak_probability_score] |
Create User_Risk_Alert
| Attribute | Detail |
|---|---|
| Trigger | ML Pipeline saves forecast with outbreak_probability_score > 0.80 |
| Actors | System (automated) |
| Pre-conditions | High-risk forecast exists |
| Flow | 1. System intercepts high-risk trigger → 2. Queries all users assigned to affected zone_id → 3. Retrieves user_id and email_address from USER table → 4. Formats alert payload (status = 'Active') → 5. Dispatches email → 6. INSERT into USER_RISK_ALERT |
| Post-condition | New records in USER_RISK_ALERT linking user_id to forecast_id with alert_status = 'Active' |
Update Alert Status
| Attribute | Detail |
|---|---|
| Trigger | User clicks "Acknowledge" or "Resolve" on an active alert in the dashboard |
| Actors | User |
| Pre-conditions | Alert exists in DB with alert_status = 'Sent' or 'Active'; user authenticated |
| Flow | 1. User logs in, navigates to Active Alerts panel → 2. System fetches alerts for user's zones → 3. User clicks alert → 4. System fetches corresponding forecast details → 5. User reviews outbreak_probability_score and map → 6. User clicks 'Acknowledge Alert' → 7. System updates alert_status = 'Acknowledged' |
| Post-condition | Alert record updated; removed from Active view; moved to Historical/Resolved |
Read Malaria_Risk_Forecast
| Attribute | Detail |
|---|---|
| Trigger | User navigates to Risk Map dashboard view |
| Actors | User |
| Pre-conditions | Forecasts exist for the current date range |
| Flow | 1. User clicks Risk Map tab → 2. System requests polygon boundaries (ZONE table) and latest forecasts (MALARIA_RISK_FORECAST) → 3. System merges spatial data with forecast scores, applies colour coding (red > 0.80) → 4. User views rendered interactive map |
| Post-condition | Read-only — no DB state changes |
Download use case document
Download Use Case Set (.docx) →