Data Architecture & Entity Relationship Diagrams
The data architecture is split into two logical models: the Observation Prediction model (the core backend analytical engine) and the User Management model (access control and alerts). Both ERDs follow crow's-foot notation.
Observation Prediction ERD
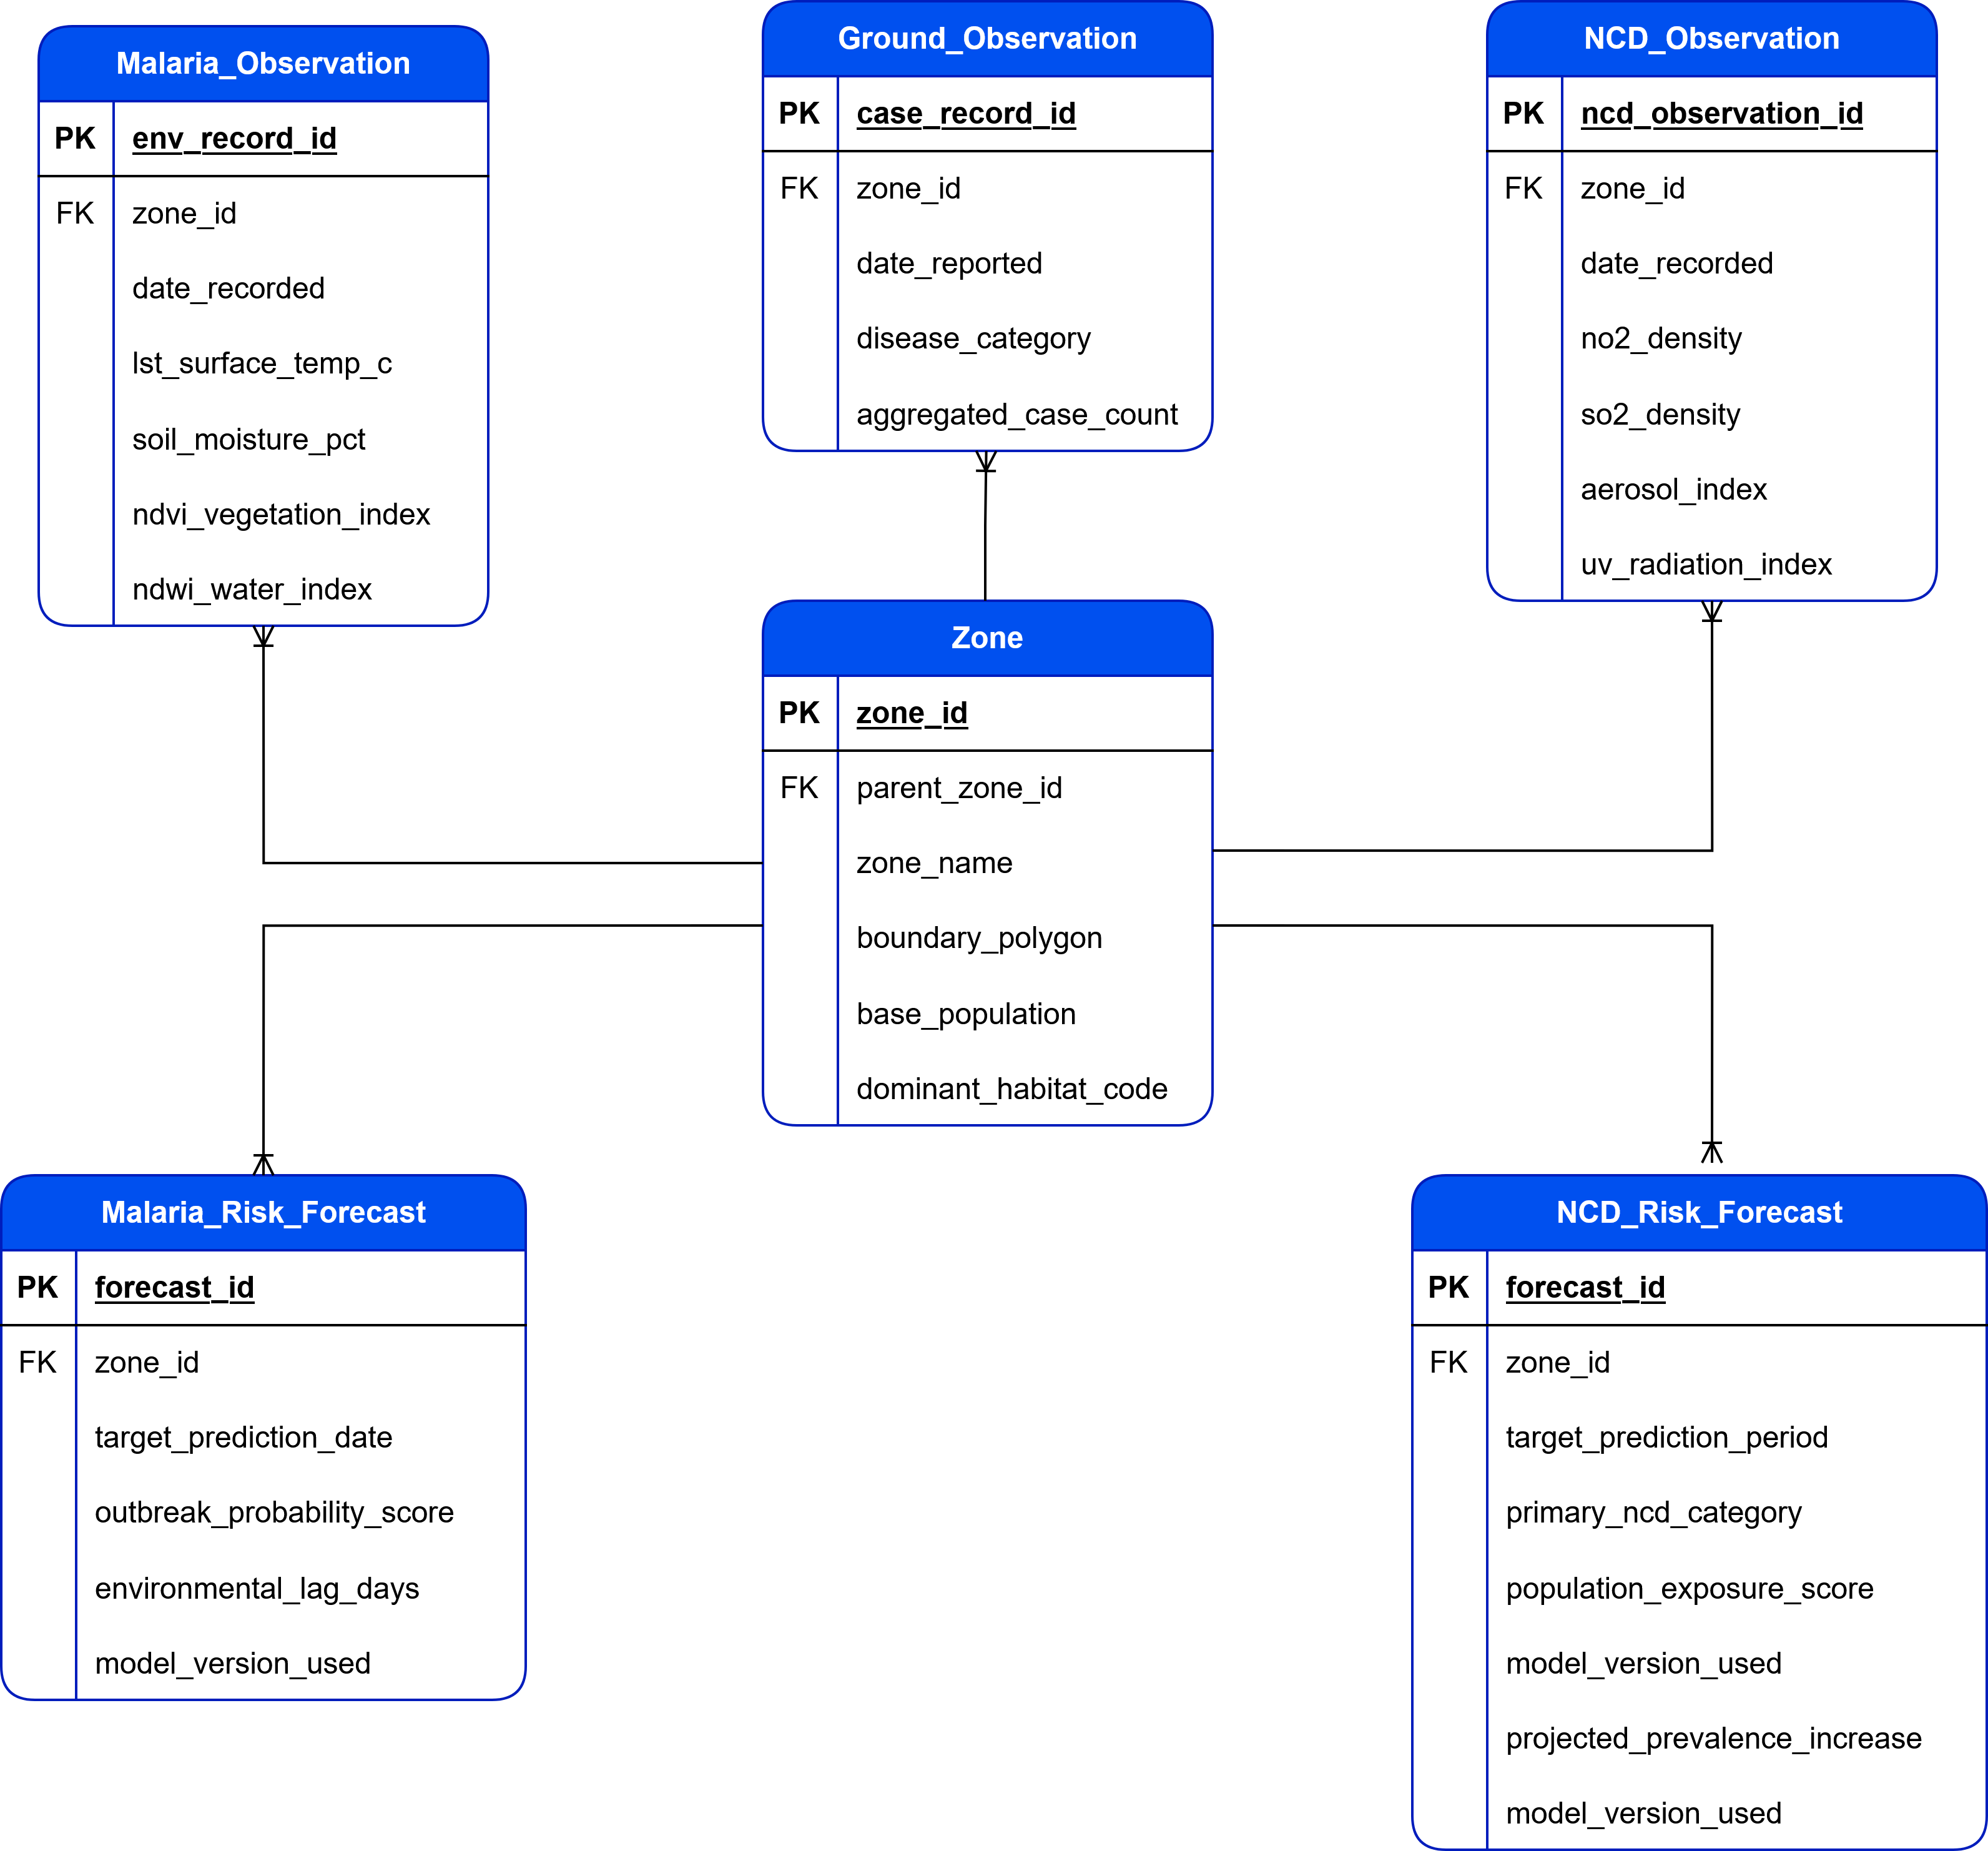
This ERD maps the core backend entities. The Zone table is the spatial anchor — all observation and forecast tables relate to it via zone_id. The model supports dual-disease forecasting through parallel Malaria and NCD entity sets.
Entity summary
| Entity | PK | Key fields | Purpose |
|---|---|---|---|
Zone | zone_id | parent_zone_id, boundary_polygon, base_population, dominant_habitat_code | Spatial unit — ward / district / municipality |
Malaria_Observation | env_record_id | zone_id (FK), lst_surface_temp_c, soil_moisture_pct, ndvi_vegetation_index, ndwi_water_index | EO-derived environmental readings per zone per date |
NCD_Observation | ncd_observation_id | zone_id (FK), no2_density, so2_density, aerosol_index, uv_radiation_index | Atmospheric pollution readings per zone |
Ground_Observation | case_record_id | zone_id (FK), disease_category, aggregated_case_count | Clinically reported case counts |
Malaria_Risk_Forecast | forecast_id | zone_id (FK), outbreak_probability_score, environmental_lag_days, model_version_used | XGBoost-generated outbreak probability |
NCD_Risk_Forecast | forecast_id | zone_id (FK), primary_ncd_category, population_exposure_score, projected_prevalence_increase | NCD exposure and prevalence projections |
Key relationships
Zone→Malaria_Observation: one zone has many observations (1 to many)Zone→Ground_Observation: one zone has many case reports (1 to many)Zone→Malaria_Risk_Forecast: one zone has many forecasts (1 to many)Zoneis self-referencing viaparent_zone_id(ward → district → municipality hierarchy)
User Management ERD
This ERD maps the access control and notification entities. User is the central entity, linked to a Role for permissions and to User_Risk_Alert for personalised outbreak warnings.
Entity summary
| Entity | PK | Key fields | Purpose |
|---|---|---|---|
User | user_id | role_id (FK), email_address, password_hash, organization, first_name, last_name | Platform user profile |
Role | role_id | role_name, permissions | RBAC role definition |
User_Risk_Alert | alert_id | user_id (FK), forecast_id, alert_status, sent_timestamp | Per-user alert record linked to a forecast |
Key relationships
User→Role: many users share one role (many to one)User_Risk_Alert→User: many alerts per user (many to one)User_Risk_Alert.forecast_idreferences eitherMalaria_Risk_ForecastorNCD_Risk_Forecast
Alert status lifecycle
[System creates forecast with score > 0.80]
        ↓
  alert_status = 'Active'
        ↓
  User acknowledges alert
        ↓
  alert_status = 'Acknowledged'
        ↓
  User resolves / closes
        ↓
  alert_status = 'Resolved'  →  moved to Historical view
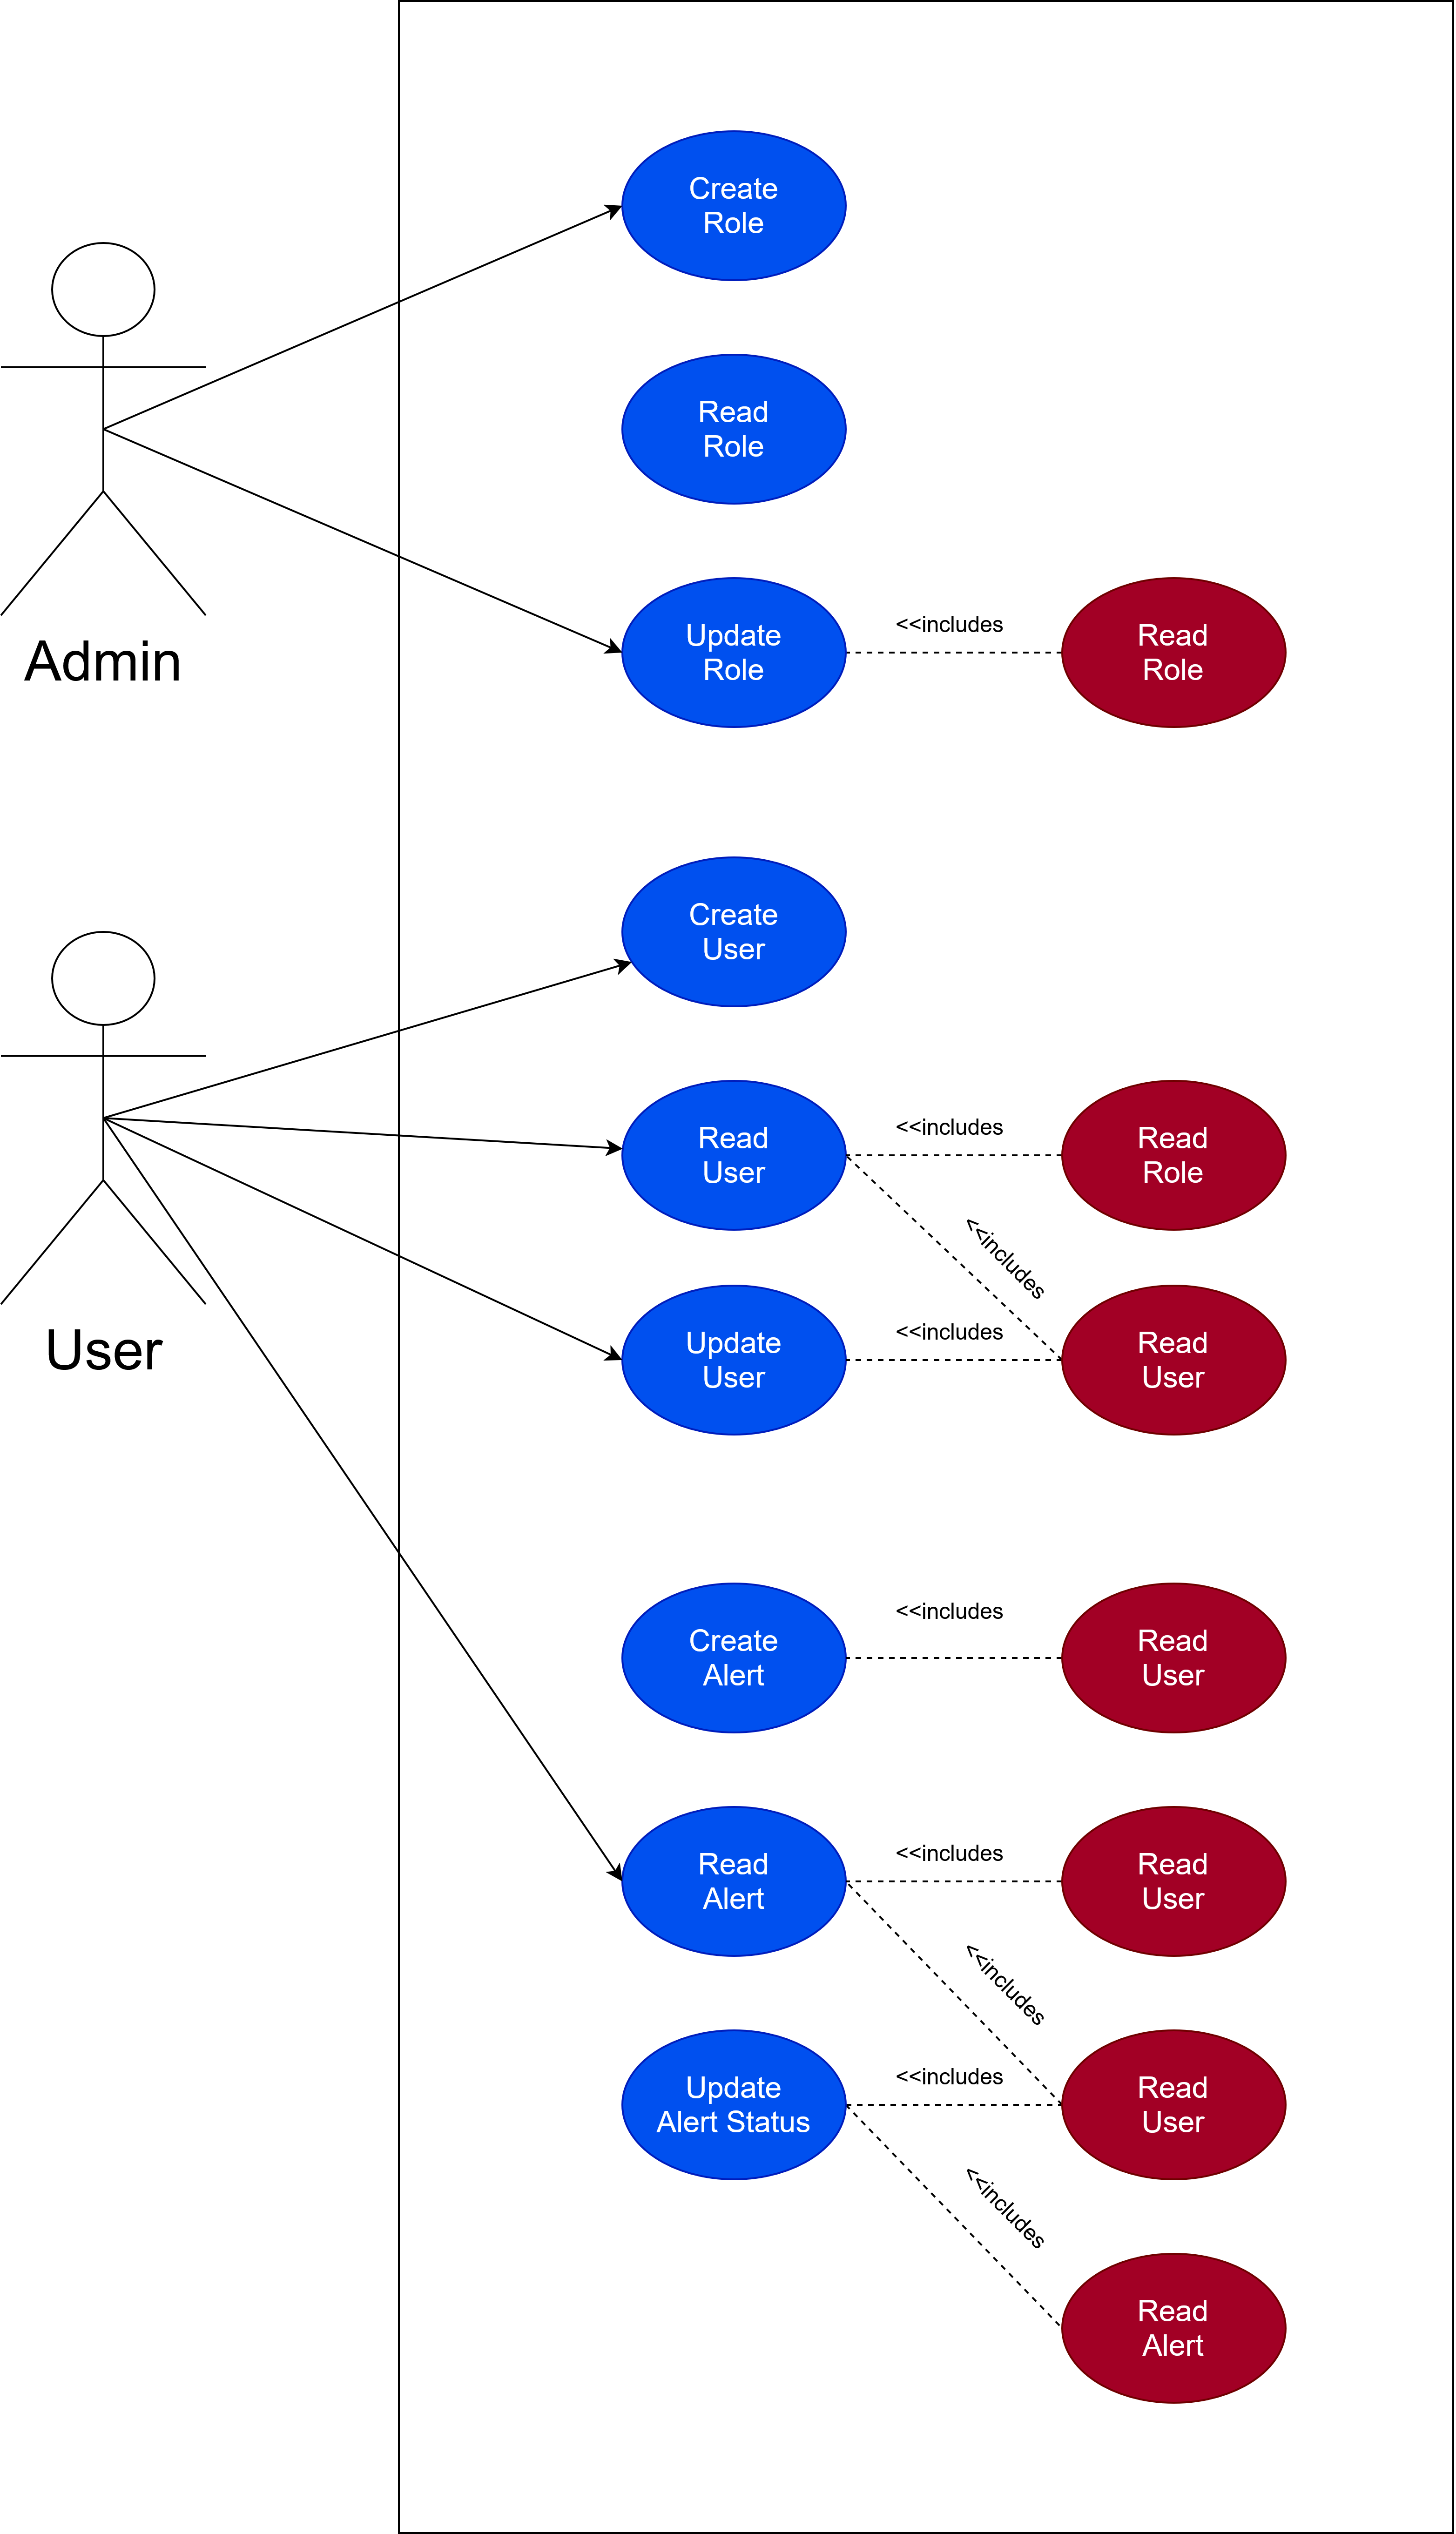
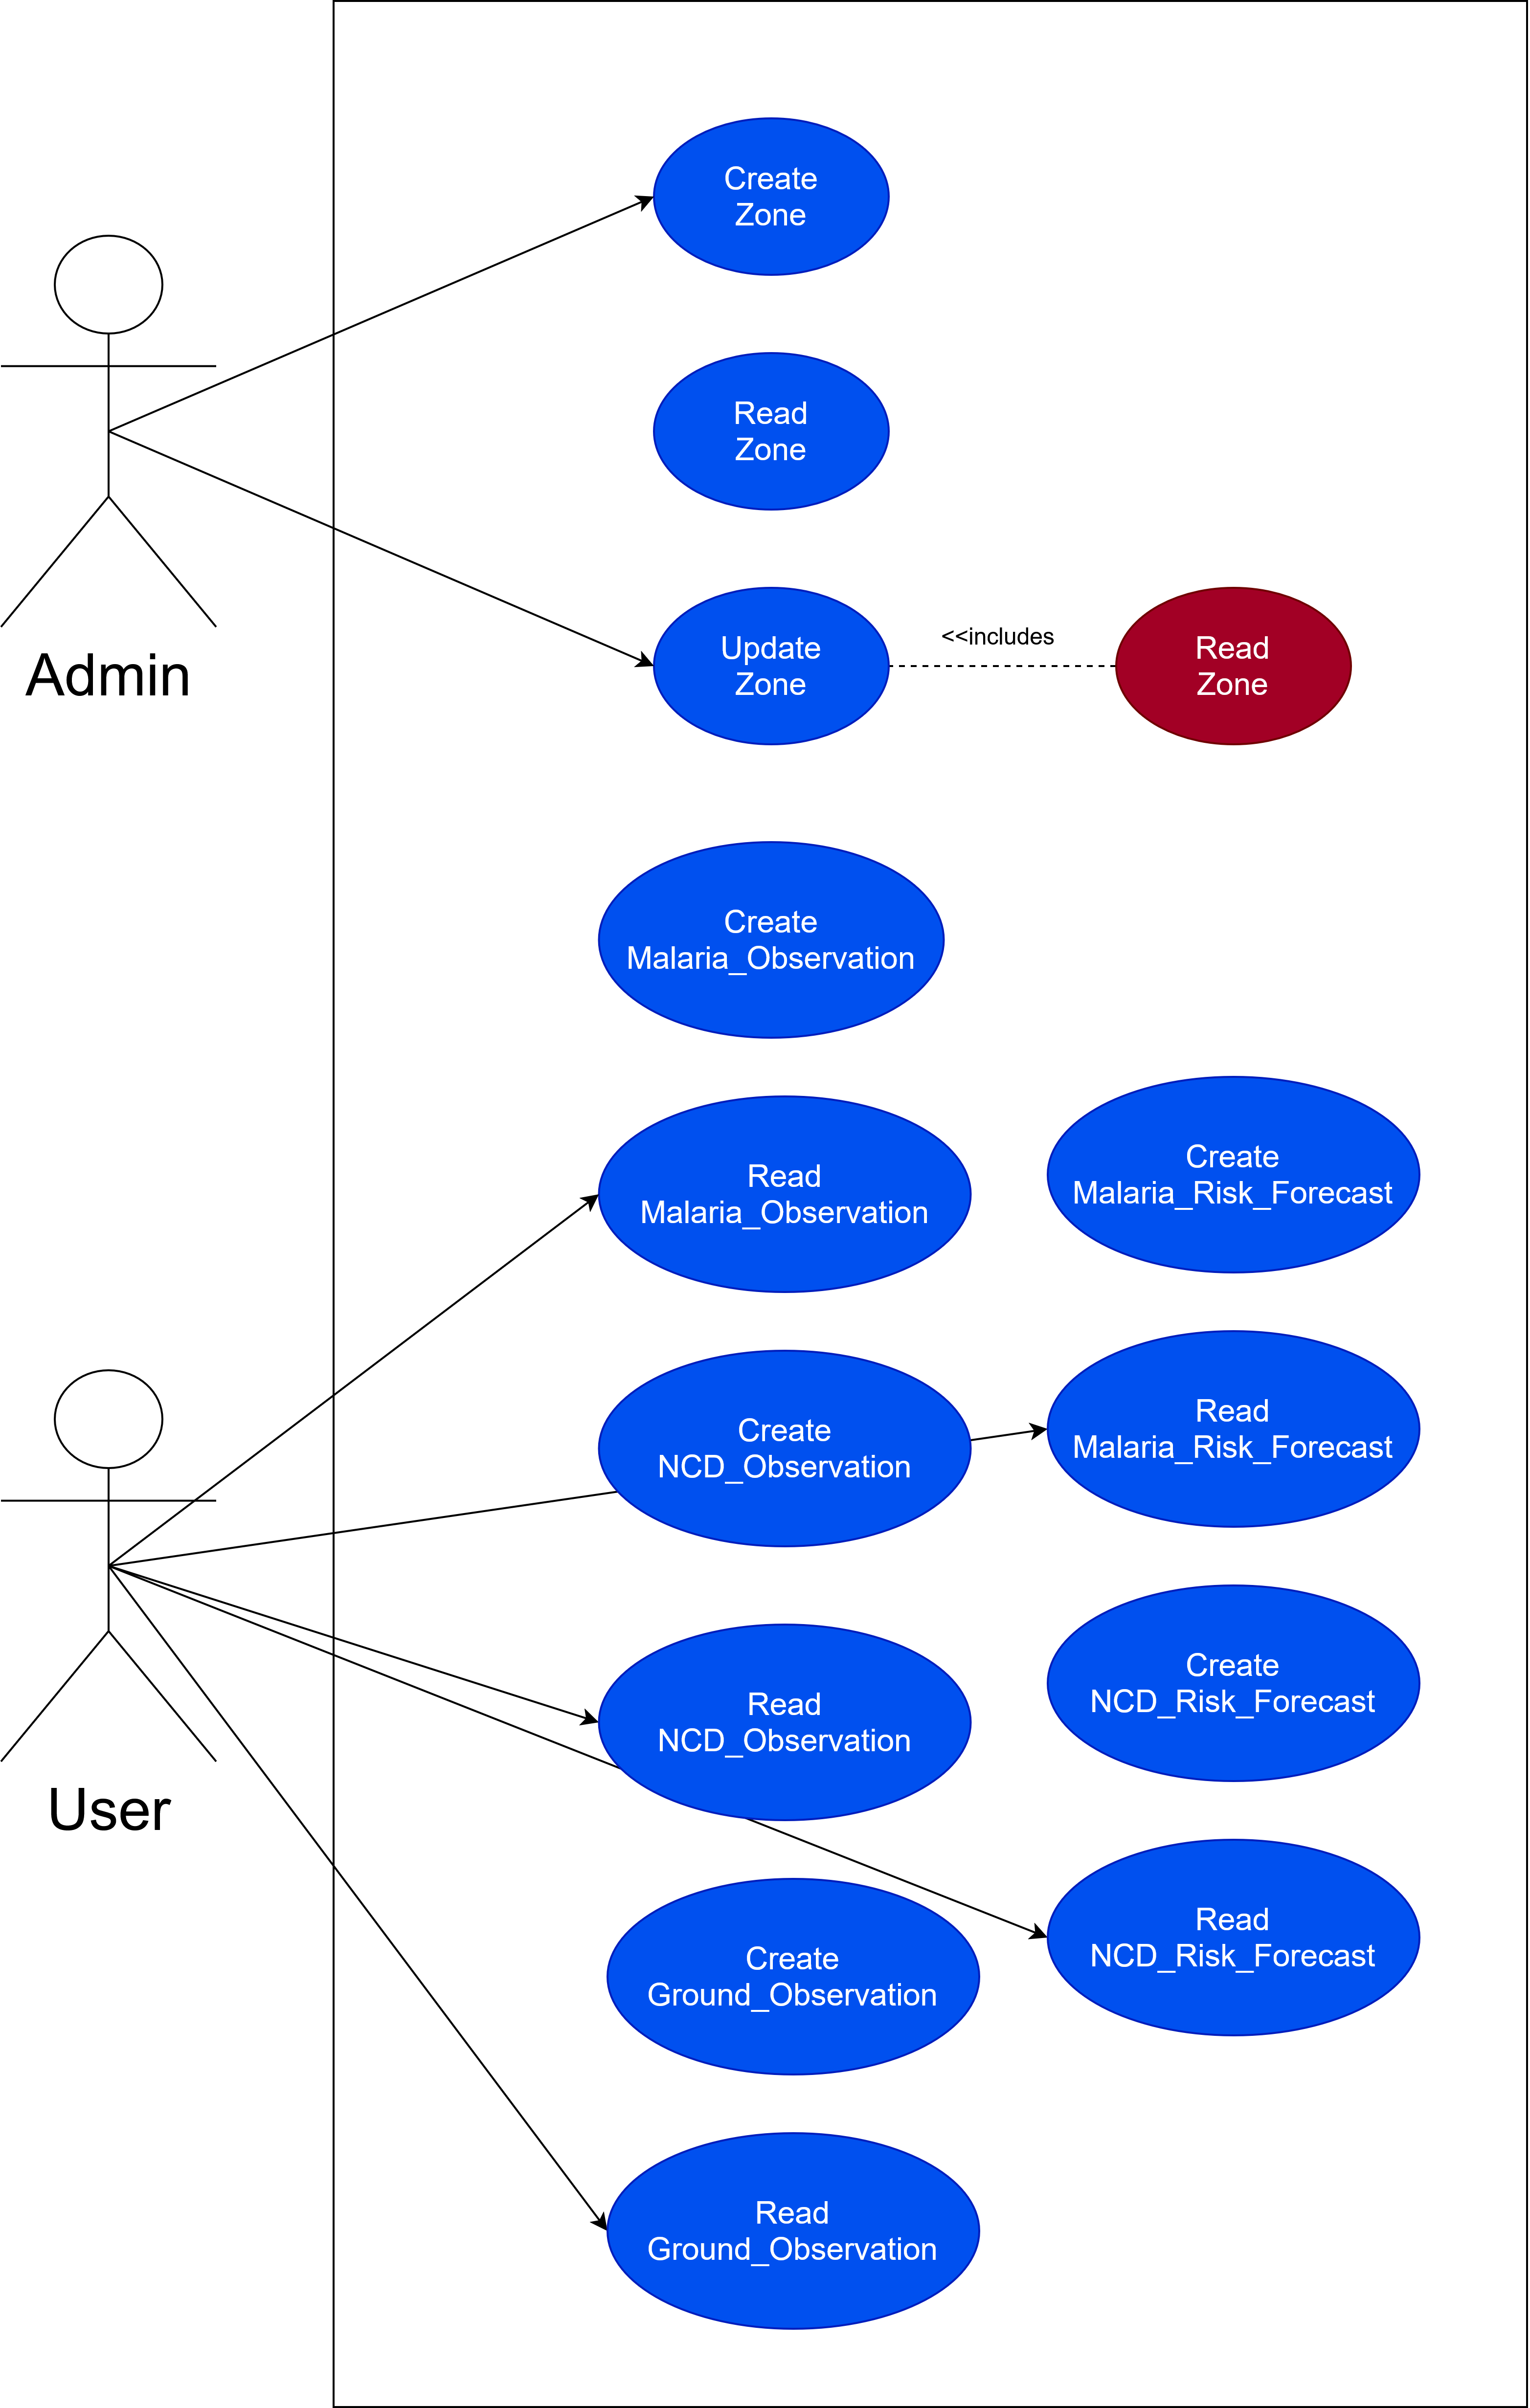
API Use Case ERD
The following diagram shows how the API layer relates to the use case model, connecting external actors to the system's REST endpoints.
NCD environmental indicators
| Field | Description |
|---|---|
UniqueID | District/ward identifier |
latitude / longitude | Location coordinates |
NO2_Column_Density | Average NO2 exposure (mol/m²) |
SO2_Column_Density | Average SO2 exposure |
Aerosol_Index_PM | Particulate matter proxy |
Aerosol_Index_Silica | Silica aerosol index |
UV_Index | UV radiation level |
LST_Mean_C | Land surface temperature (°C) |
Urban_Cover_Percentage | Urban land cover ratio (%) |
Malaria environmental indicators
| Field | Description |
|---|---|
UniqueID | District/ward identifier |
latitude / longitude | Location coordinates |
LST_Surface_C | Surface temperature (°C) |
Soil_Moisture | Volumetric soil moisture |
NDWI_water | Normalised Difference Water Index |
Habitat_Vegetation_Index | NDVI — vegetation suitability for vectors |
Population_Density_Per_KM2 | Human-vector interaction proxy |