Operational Workflow
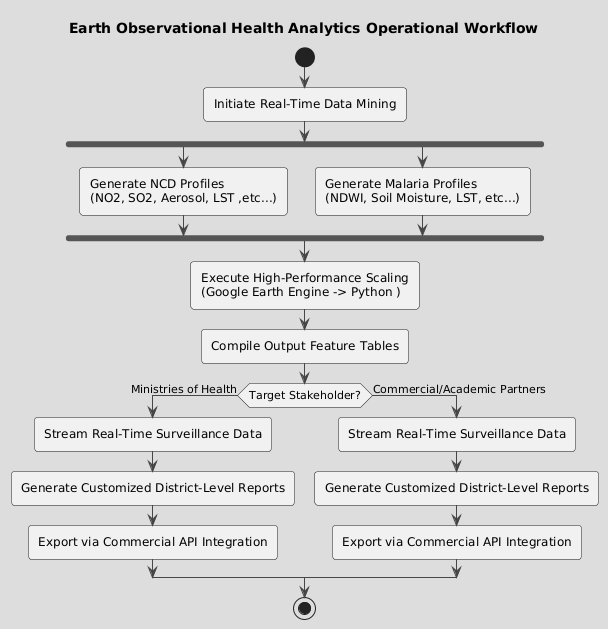
The following UML activity diagram defines the complete operational sequence from real-time data mining through to stakeholder delivery. It captures the parallel NCD and Malaria profiling tracks and the decision point that routes output to different stakeholder types.
Activity diagram
Workflow sequence
1. Initiate Real-Time Data Mining
The workflow begins when the Scheduler (Kubernetes CronJob) fires. Both disease tracks run in parallel:
| Track | Profiles generated | Key indicators |
|---|---|---|
| NCD | NCD Profiles | NO2, SO2, Aerosol, LST, urban cover |
| Malaria | Malaria Profiles | NDWI, Soil Moisture, LST, NDVI, habitat type |
2. Execute High-Performance Scaling
After parallel profiling completes, outputs are merged and passed through the Google Earth Engine → Python scaling pipeline, running on CSIR high-performance compute infrastructure:
- GEE handles large-scale raster computation and zonal statistics
- Python (XGBoost / PCA) handles ML inference and feature aggregation
- Results compiled into Output Feature Tables (one per disease track)
3. Target Stakeholder routing
A decision point determines the delivery pipeline based on the identified target stakeholder:
| Stakeholder | Delivery |
|---|---|
| Ministries of Health | Stream real-time surveillance data → generate customised district-level reports → export via commercial API integration |
| Commercial / Academic Partners | Stream real-time surveillance data → generate customised district-level reports → export via commercial API integration |
Both paths follow the same delivery sequence — the content and access permissions differ based on the user's assigned Role.
4. Export via Commercial API Integration
Final output is served through the platform's REST API, enabling:
- Integration with intergovernmental agency dashboards
- Postgraduate research data access
- Commercial health analytics partners
Business rules governing this workflow
| Rule | Applies at stage |
|---|---|
| BR-01: Minimum 24-hour refresh cycle | Stage 1 — Data Mining |
| BR-03: Immutable audit log for all ingest events | Stage 1 & 2 |
| BR-04: Automated Quality Test before ingest | Stage 1 |
| DR-04: Raster/vector spatial-temporal alignment before PCA | Stage 2 — Scaling |
| DR-01: Malaria constrained by environmental thresholds | Stage 2 — Profiling |
| DR-02: NCD weights long-term exposure metrics | Stage 2 — Profiling |
| BR-02: Predictive disclaimer on all outputs | Stage 3 & 4 — Delivery |